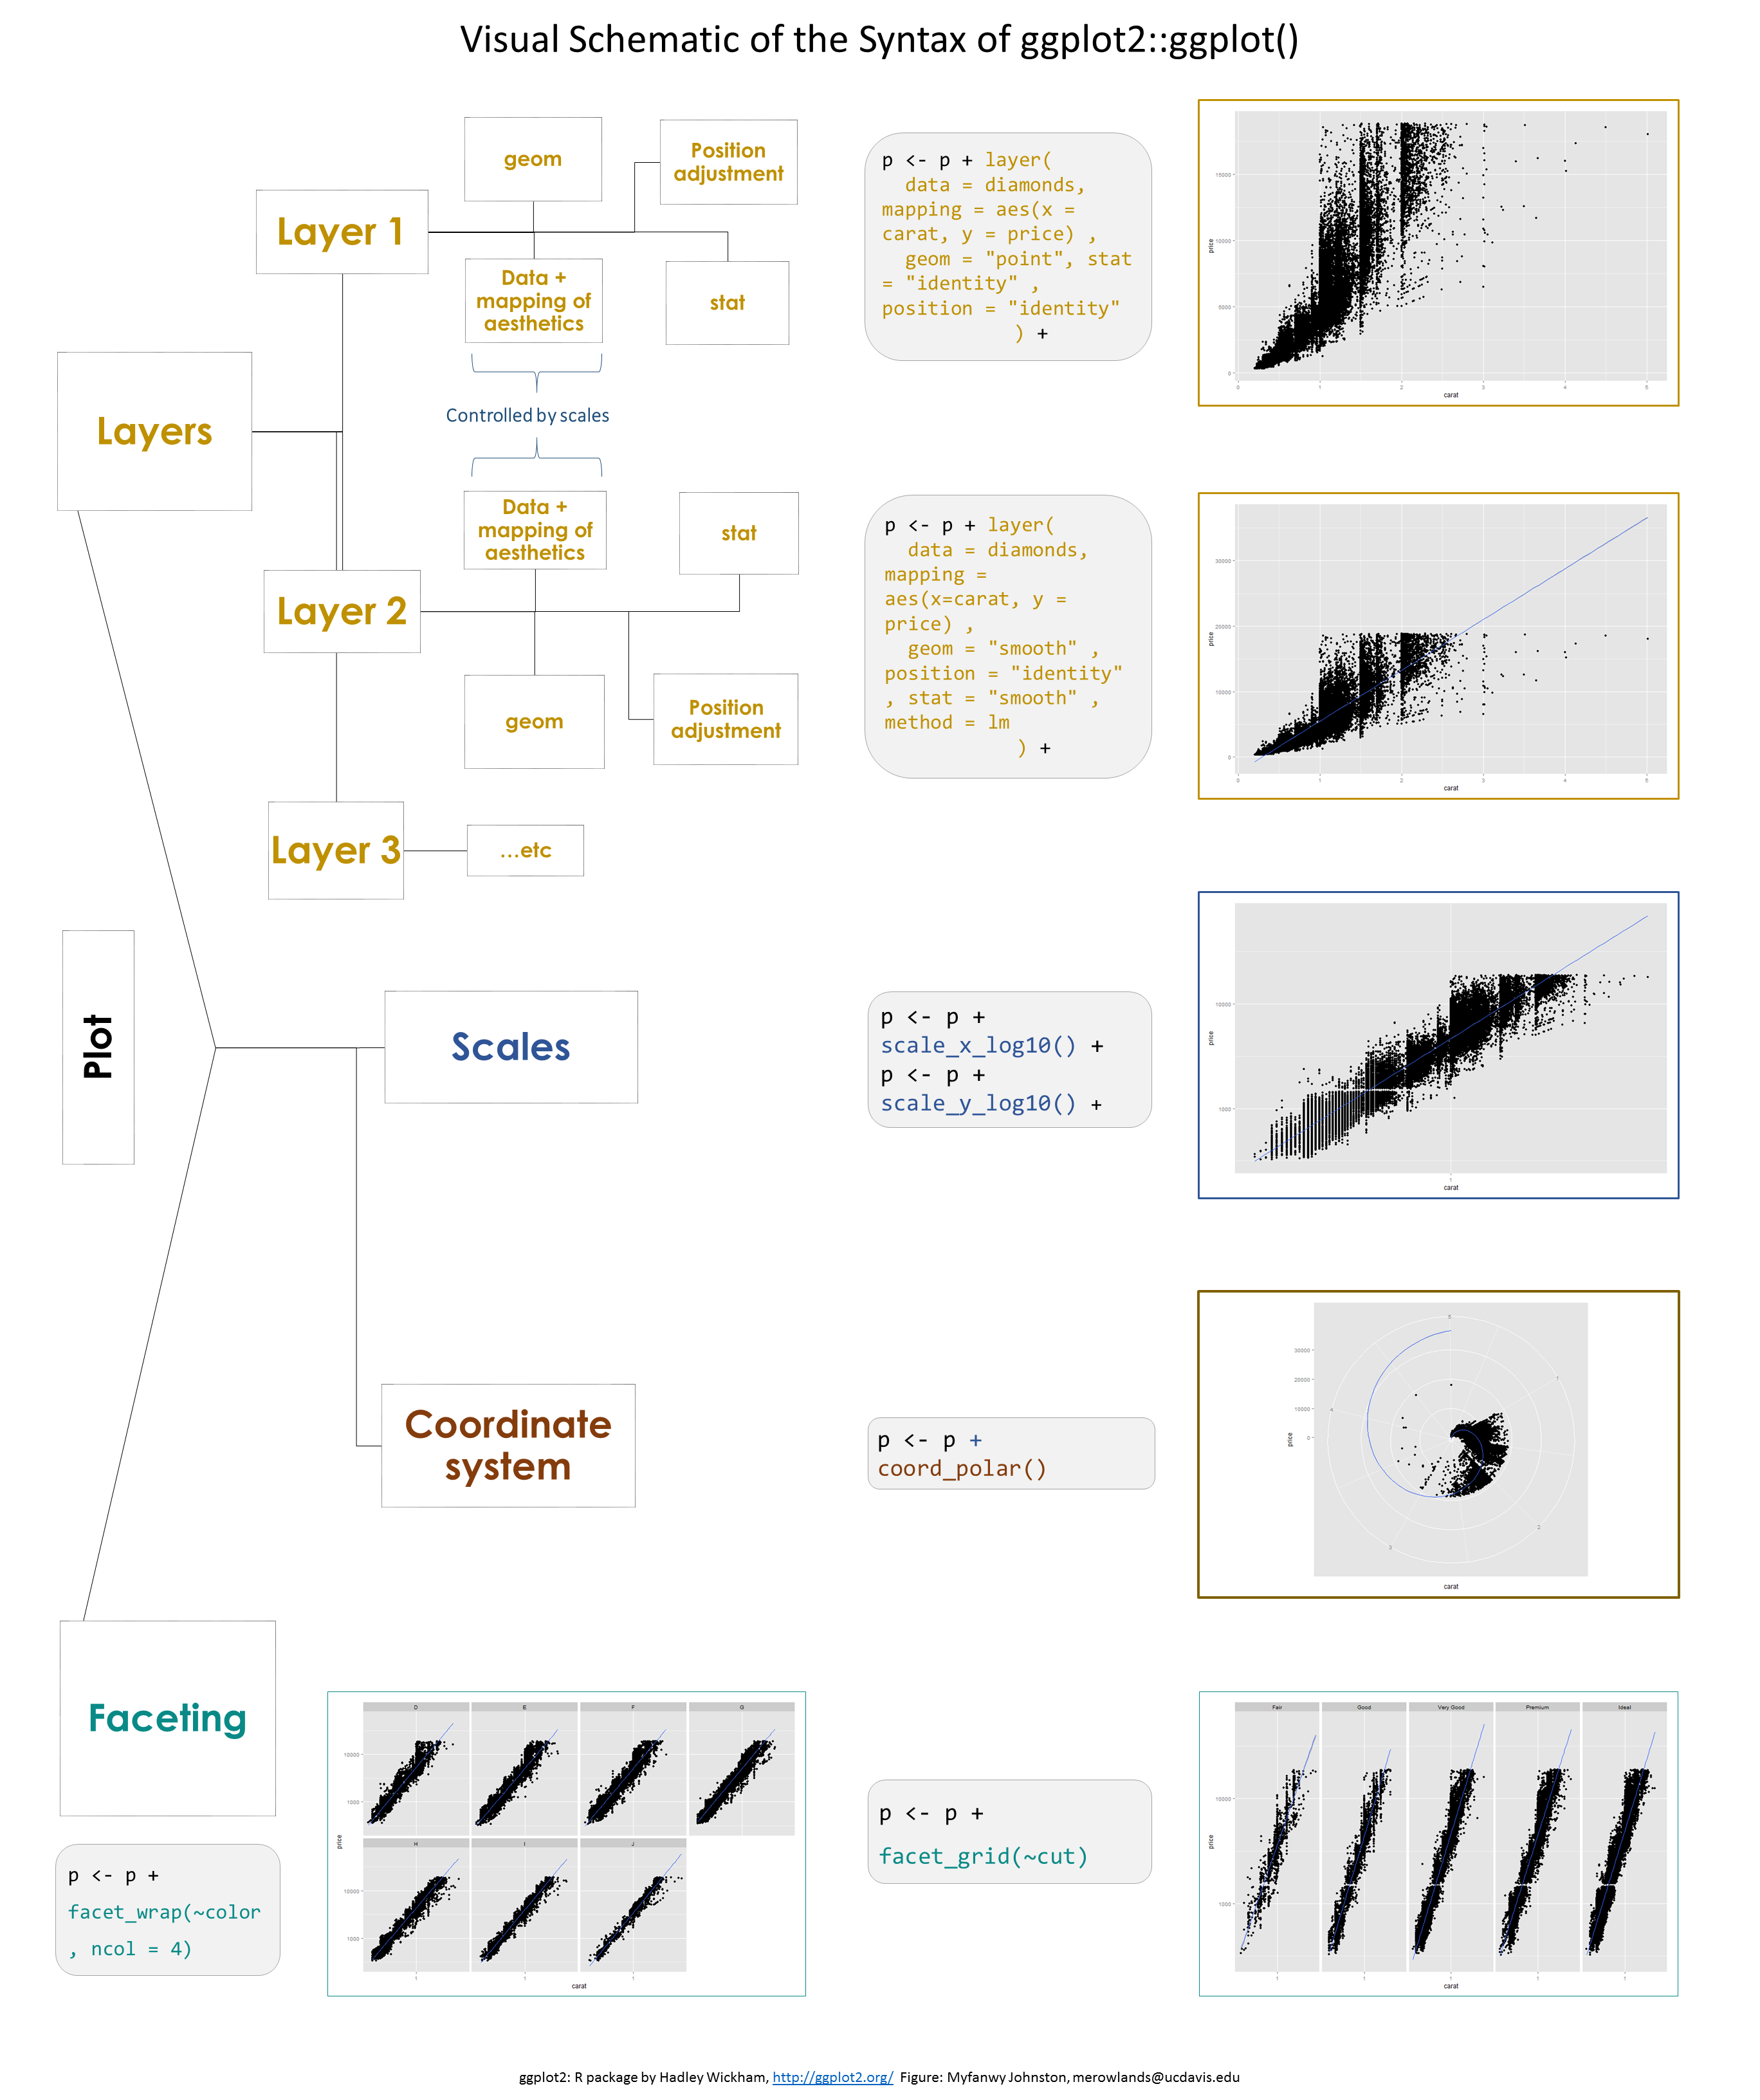
Last week at the Davis R Users’ Group, Myfanwy Johnston gave an introduction to the powerful and ubiquitous ggplot2 package for plotting in R. See below for the screencast and her particularly enlightening figure of how ggplot’s syntax and conceptual approach. Myfanwy also placed all her slides, code, and links to more ggplot resources in this GitHub repository.
(In a D-RUG first, there was an actual small fire that occurred between ~23:10 - 25:40. No graphing took place in this interval.)