I wrote a few functions to grab data and from the Global Pollen Database:
source("~/code/_Pollen/pollendatafuntions.R")
## Loading required package: stratigraph
## Loading required package: grid
## Loading required package: graphics
## Loading required package: stats
billys <- getpctAP("billys", plot = TRUE)
## Number of taxa:  105
## Number of levels: 77 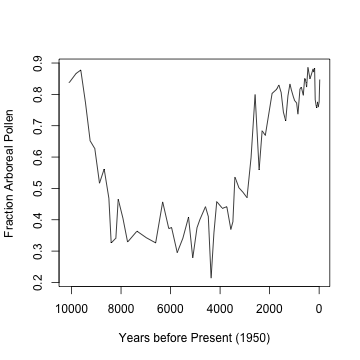
Clearly, there’s are trends at different time scales. The trouble with using S-Maps on this is that there are uneven sampling intervals. One option is to use linear interpolation to approximate even intervals:
billyslin <- linpctAP(billys, ts = FALSE)
billys <- getpctAP("billys", plot = TRUE)
## Number of taxa:  105
## Number of levels:  77
lines(billyslin[, 1], billyslin[, 2], col = "red")
points(billyslin[, 1], billyslin[, 2], col = "red",
    pch = 16)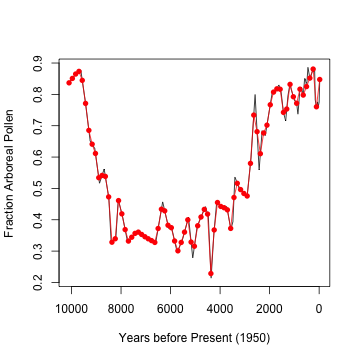
This means introducing a new source of error into whatever model is ultimately used. What interval should be used to generate this? Here I created an equal number of points as are in the original data set. However, the sampling density is greater at more recent dates. S-Maps can handle missing data, but there need to be a good chunk of consecutive points.
The other option is start thinking about how to generalize S-Maps for data sampled at unequal intervals.